Industry Reports Database
Background: Industry Reports Database is one of the main features of the company's internal M&A web-based software, which aims to support the company's venture investment decisions and portfolio management.
Brief: Convert the Industry Reports Database from web-based to mobile. Employees from the M&A department can review and share industry reports using the database.
Team: 2 designers, 2 product managers
My Role: Interaction design
Duration: 2 weeks
Tools: Sketch, Photoshop
Scoping the project
––––
After analyzing the Industry Reports Database of the web-based software, I found that users use the feature for four main tasks:
- browse lists of reports,
- search specific reports,
- create a new report,
- view report details
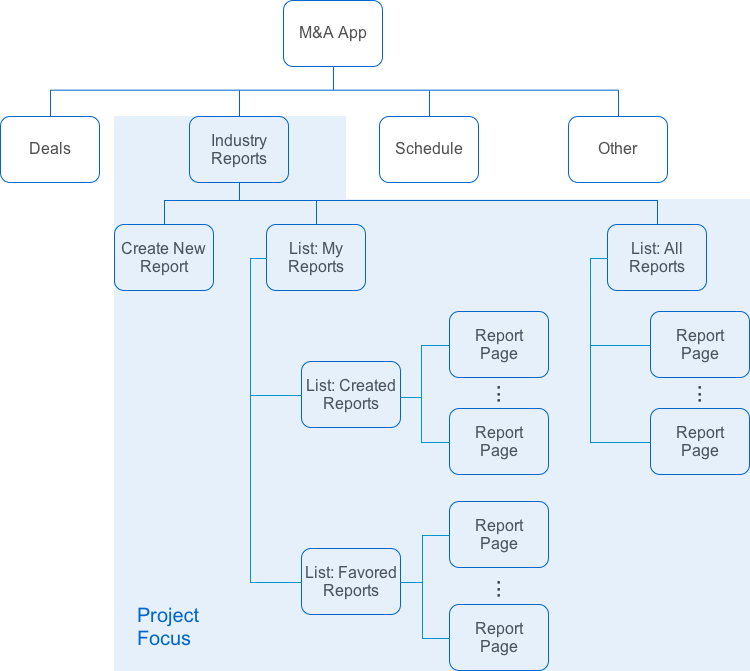
Drawing a site map helped me understand the scope of the project.
Setting design principles
––––
Users have shorter attention span and they are more time-sensitive when using mobile devices. Therefore, it was critical to understand users' primary tasks and simplify the workflow as much as possible.
User goals
Design principles
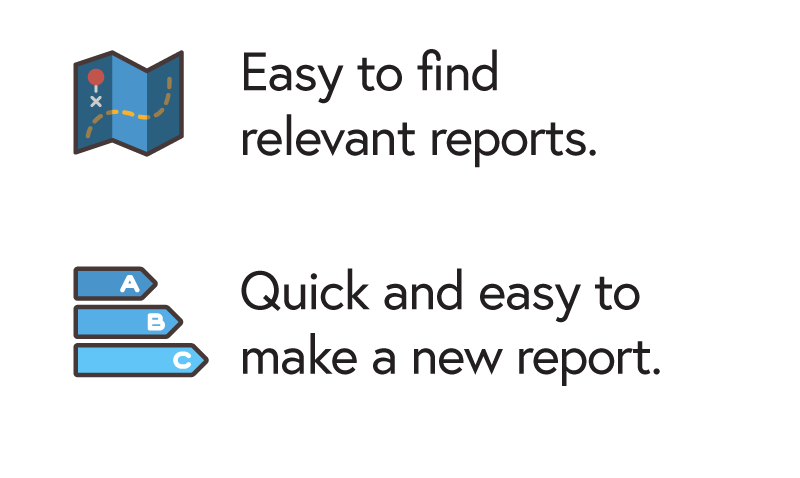
1. Enable users to quickly locate the reports they need.
- Enable users to stay on a same page to filter a report list.
- Based on typed keywords, sort reports into categories (e.g. name, industry, etc.) in real time.
- Put the attached documents of a report at the top of a report page.
2. Provide concise guidance on uploading documents for a newly created report and simplify the workflow of uploading.
My design
––––
Ideation
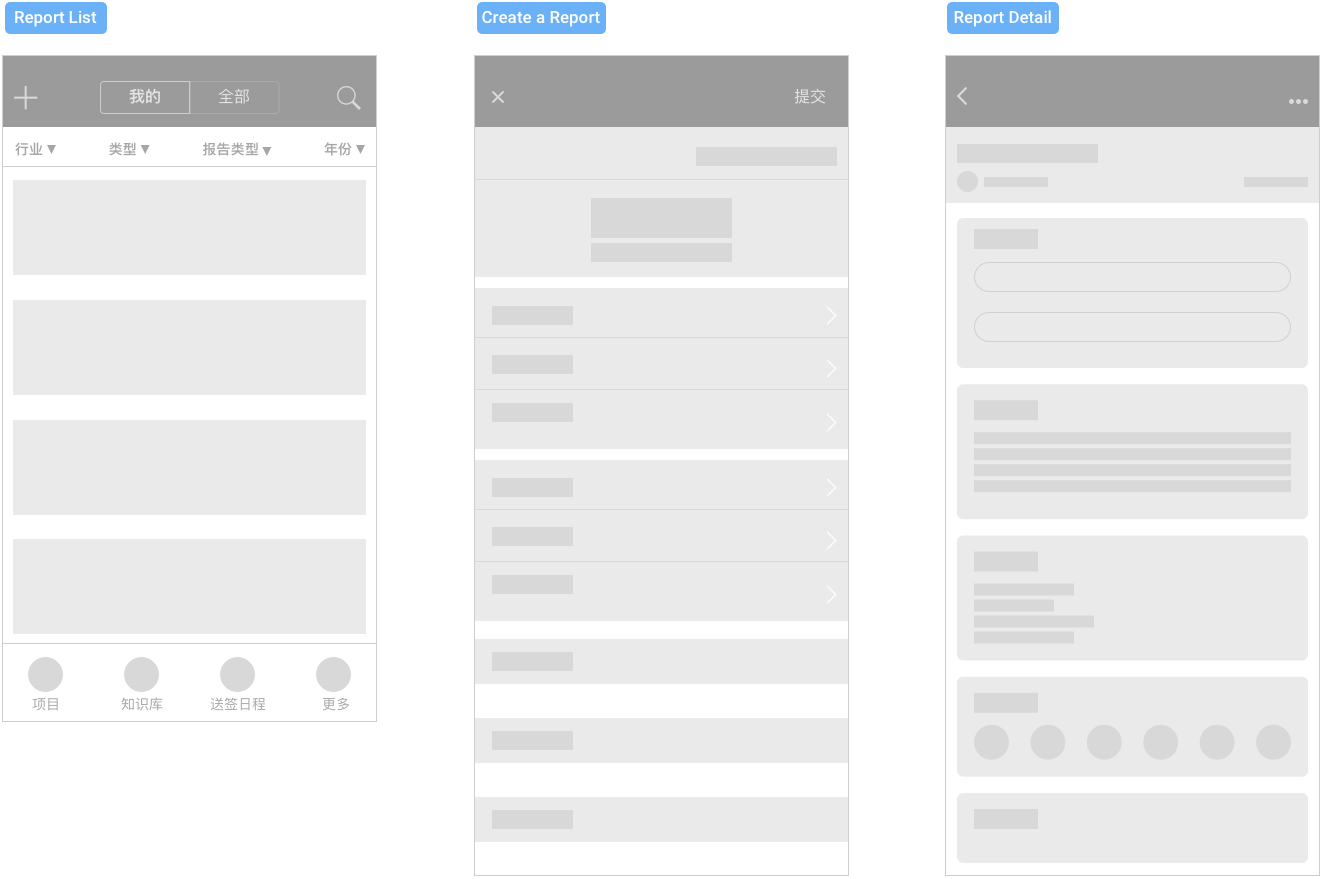
Overall wireframe structures for three main pages
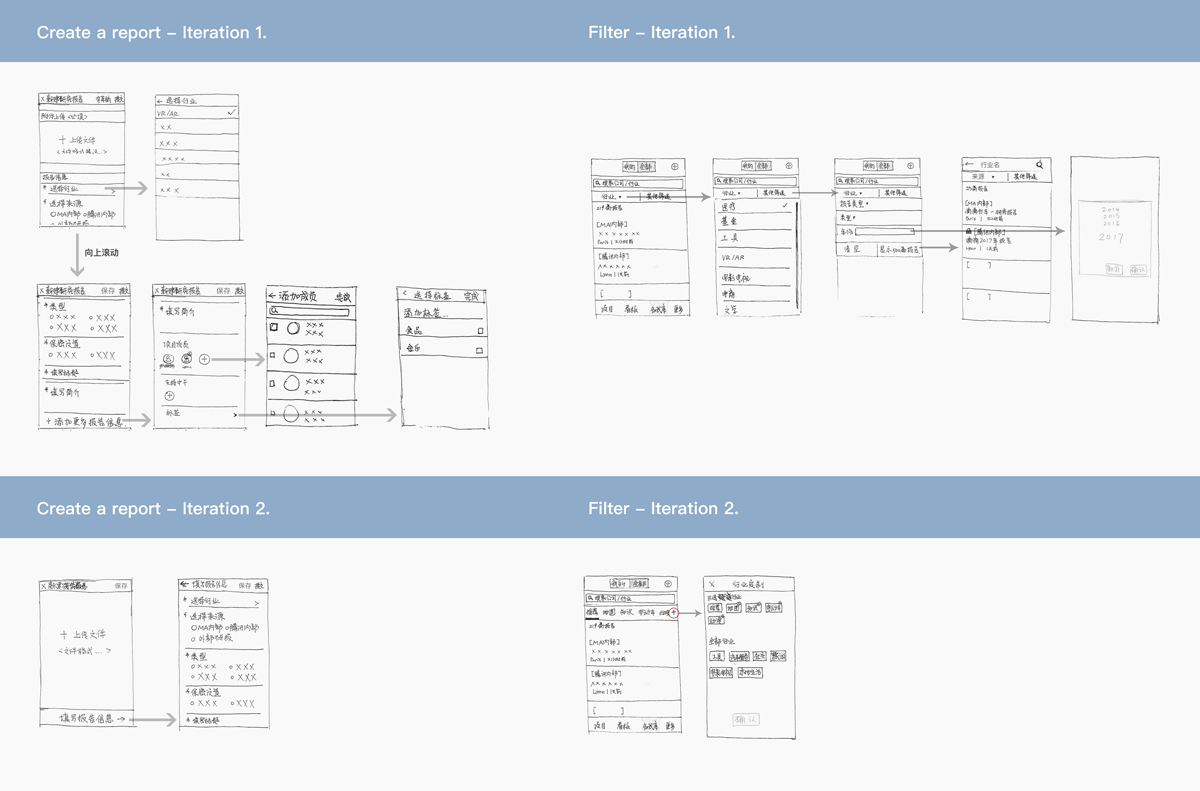
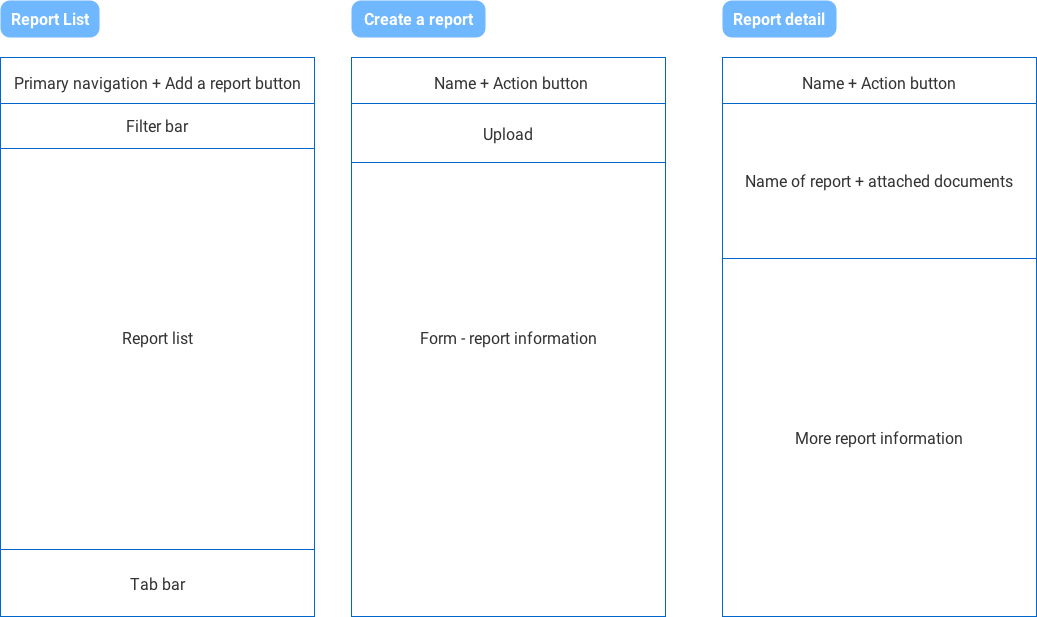
After reviewing the wireframe sketches with the product managers, we decided to go with one of the iterations that met the users needs. Before going into a detailed layout, I planned the overall structure for each type of page.
Further developed wireframe structures
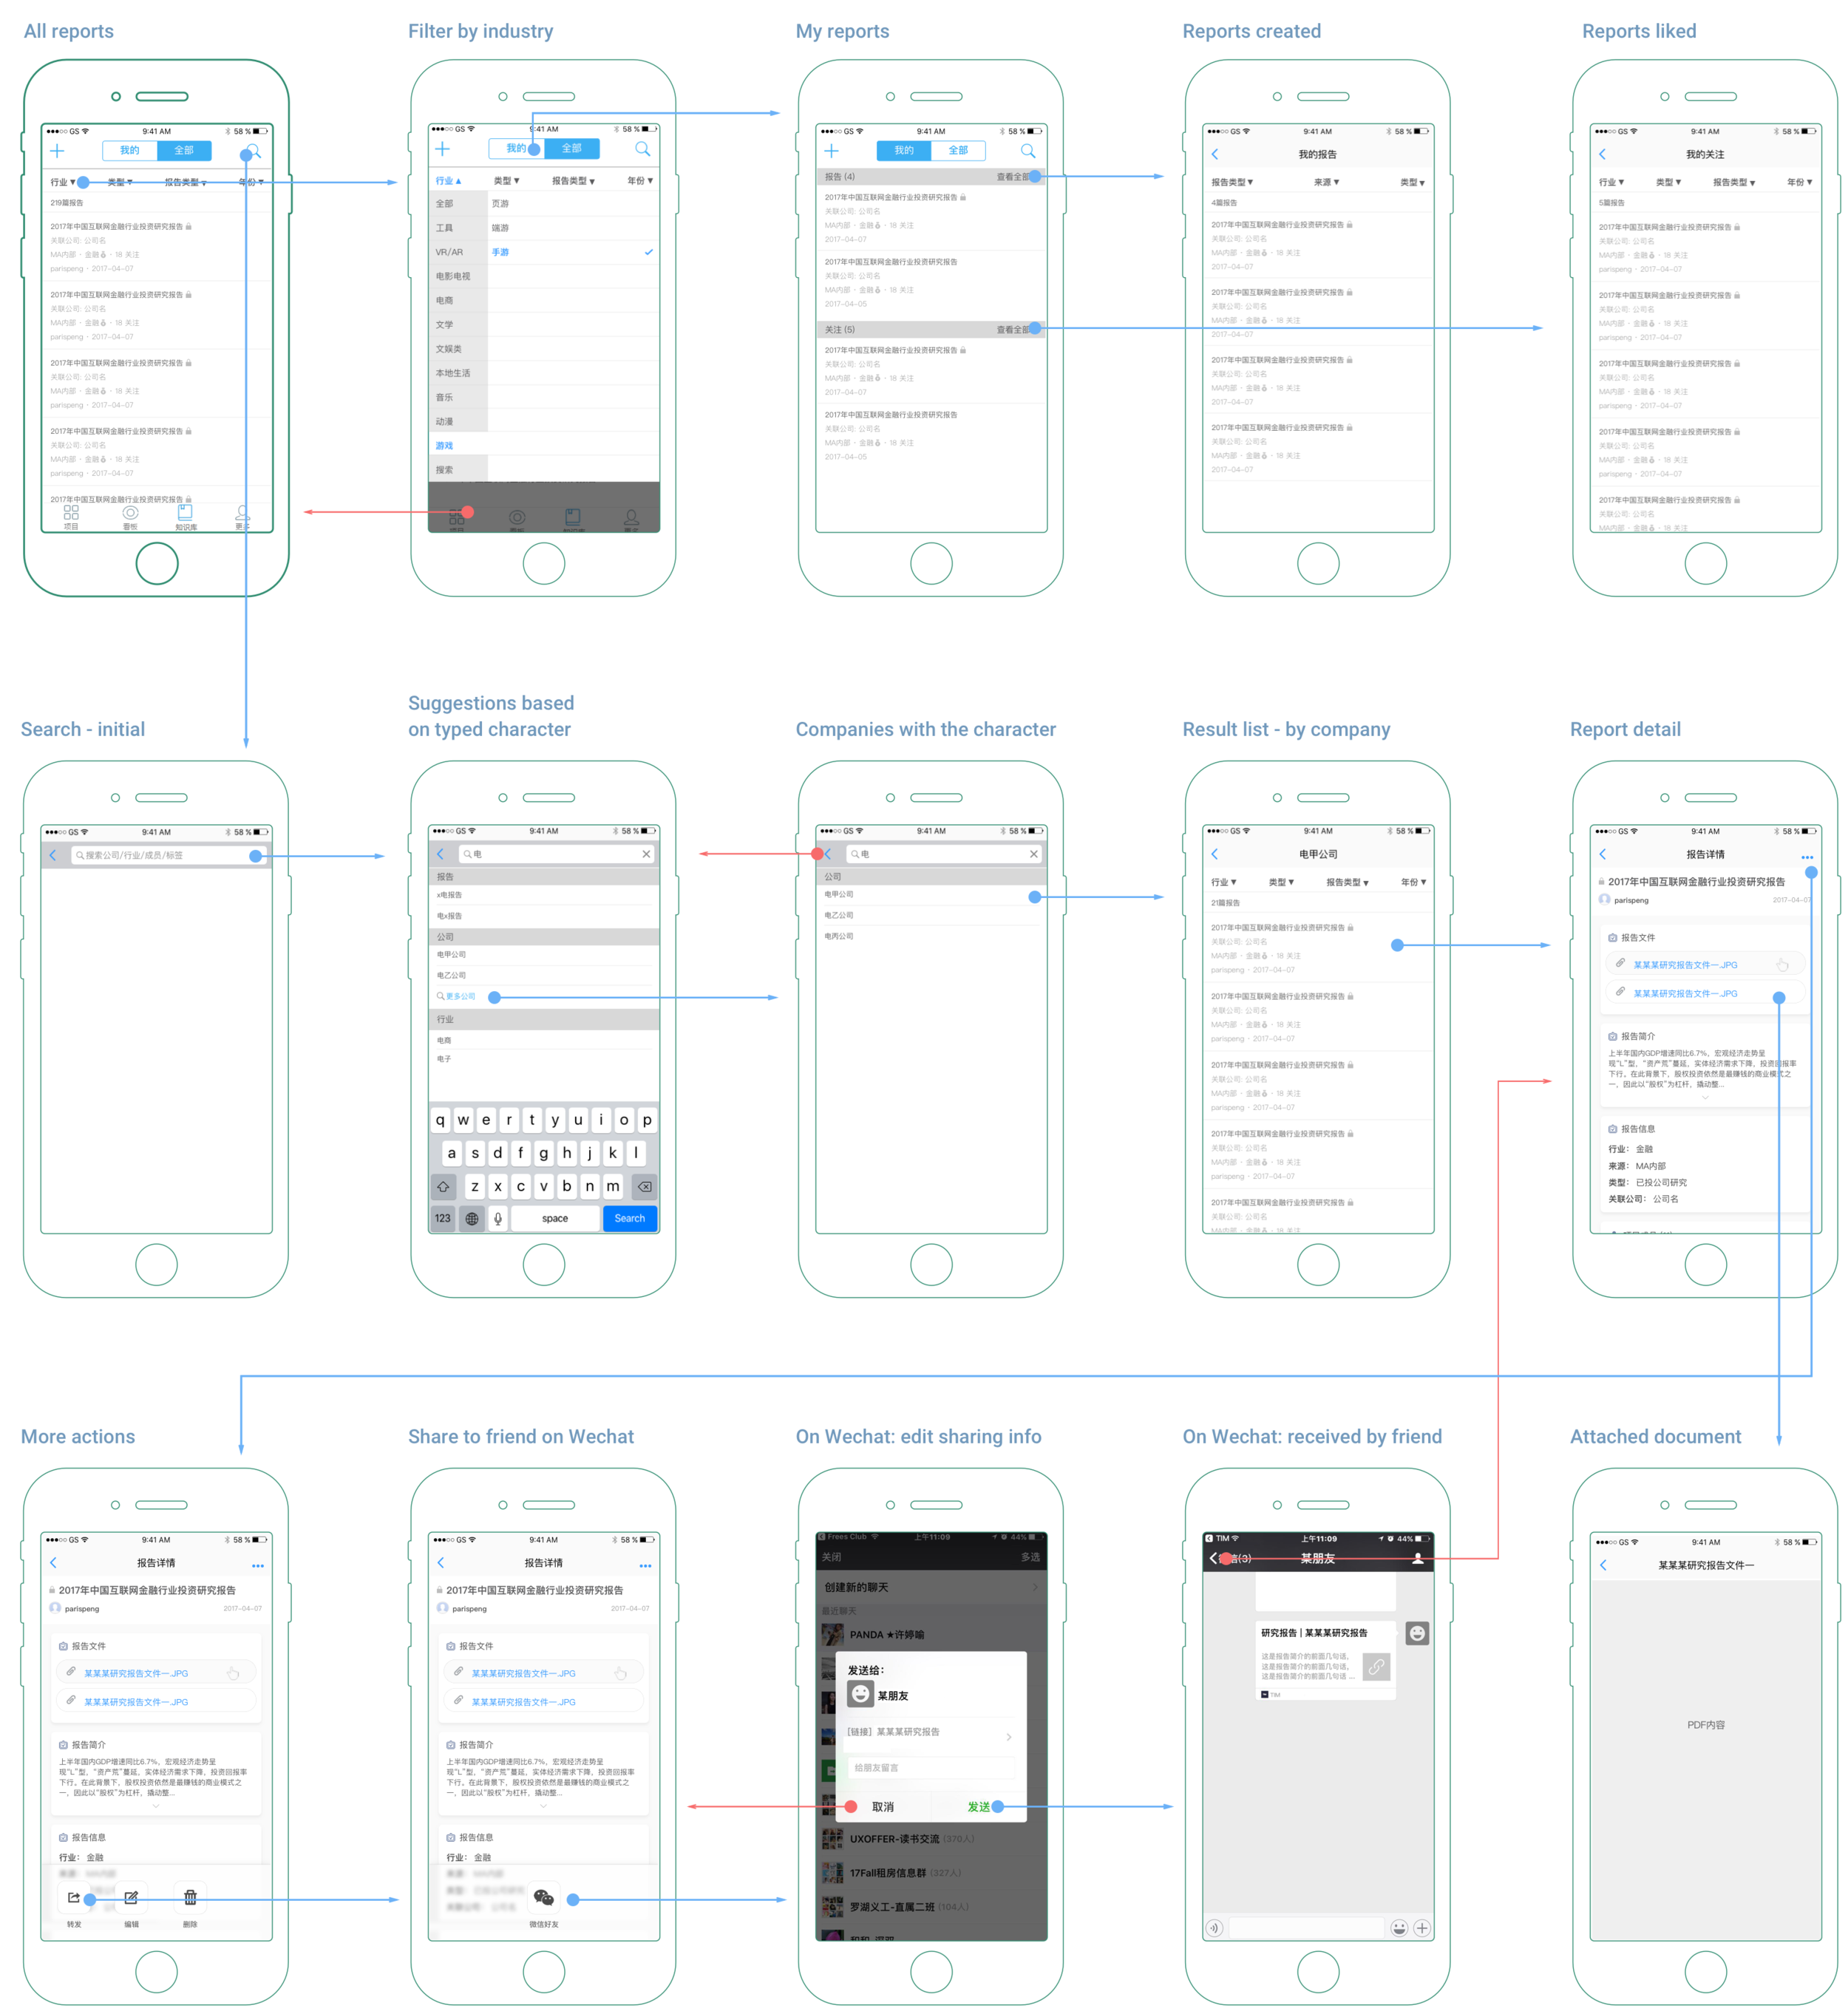
Flow chart
Higher fidelity wireframes were created based on the structures designed earlier. Flow chart was used to communicate with fellow designers and product managers. It also served as a reference for front-end developers.


